

In today's data-driven world, data is for many businesses as essential as the blood in our veins. Companies store a lot of data in all types of systems. Storing data is important, but storing low quality data makes it a useless effort. When we look at optimization packages, data is THE most important factor. Using data with low quality, equals non-usable outcomes of the optimization. Garbage in is garbage out. So, detecting that garbage and turning it into a valuable asset is an necessary first step. Data cleaning is a process that might require too much time but as experience grows, you get to know the quick sanity-checks that will often save a lot of time. Below we list some validations, ranging from 1-minute scans to deep analysis simulations.
For route optimization tools, we need a lot of data about vehicles and orders. This data consists of addresses and constraints for every particular vehicle or order. In our experience, we see following points as difficult to evaluate:
- The correctness of the addresses
- Stop Times - how much time does it take to stop at a location?
- Driver efficiency
- Opening hours - time windows
Planners who have to deal with data in their daily work life, will quickly spot these data issues. Especially those who work with optimization tools. Here are some sanity checks for data quality:
- Analysis of data in analyzing tools
Tools such as Excel and Tableau make it easy to visualize data. Tables, graphs, maps, ... can be created to visualize trends in the data. The following example shows how to use such a tool:
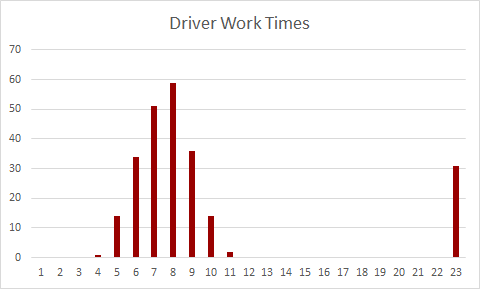
Working hours of the drivers can easily be presented in graphs, as we can see in the graph above. The x-axis shows the total work time of a driver. The y-axis shows the amount of drivers. We clearly see a trend between 4 and 11 working hours, but also an outlier with drivers who work 23 hours. When a planner is presented with these figures, an alarm bell WILL ring. Time to dig deeper and check the issue.
Not only working hours, but a lot of other questions can be tackled by using such analyzing tools. Do we see a normal allocation of orders over all zip codes? Are the start times of the drivers well-assigned? ...
- Plotting data on a map
Plotting data on a map is another easy sanity check. You can use your route optimization tool to do this. Just upload your order file, but only attach value to the address information of the orders.
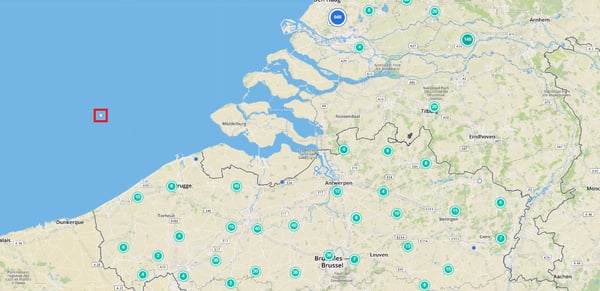
For this case, it is immediately clear that one order does not have the right coordinates. Just by uploading a simplified order set.
- Build an as-is
Building an as-is is another way to find inaccurate data. An as-is is a planning in which we simulate an already executed plan. We can do this by allocating orders to specific vehicles and by giving these orders the right sequence number. As we put this as-is planning in an optimization tool, wrong data will cause violations.
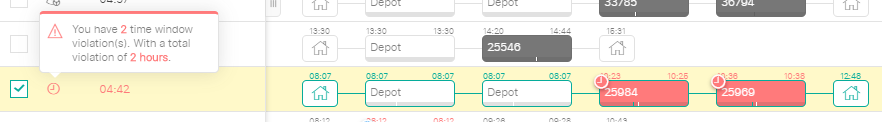
These violations can exist of time violations, capacity violations, ... All types of violations can have a lot of different causes. Time violations can be generated by
- Incorrect service times;
- Incorrect time windows;
- Incorrect work times of the driver.
Capacity violations can be generated by:
- Wrong order volumes;
- Wrong vehicle capacities.
- Track and Compare
Portable devices and on-board computers are tools that can be used for multiple purposes. They can be used as a communication tool between the drivers and the planners. In this way a planner can dispatch his planning to the driver's device, so the driver can follow his plan. Another possibility of using these devices is monitoring the routes that are executed.
The results can be analysed and compared to the existing data. Several data issues can be tested, which is also explained in our blog "Track & Trace: to measure is to know":
- Geographical coordinates
- Service times
- Time Windows
- Driver efficiency
- Traffic and Strategic insights
As you see, track & trace can be a tool to identify data issues, but we also use track & trace in the next stage: solving data issues. When we track all information through our devices, the data will be a lot less sensitive to errors. So, issues from previous steps can be tackled by using track & trace.
Data quality important for all the company's stakeholders
When using an optimization tool, data is very important for the company, but also for the clients. For clients, only one thing matters. Their orders must be executed at the right time. We can only ensure this when time windows are correct. Otherwise, the tool will plan orders when the client is not present.
Good data quality is also beneficial for the drivers. When service times and driver efficiency is well defined, drivers will receive a realistic planning. When this is not the case and service times are set too big, drivers will have a lot of waiting time during the day. When service times are set too short, drivers will not reach their following destination in time, which means a lot of stress for them.
